
Benefits of Flowcharts and Creating Them for Any School Subject
Flowcharts visualize concepts to make bigger concepts easier to understand. Teachers can use them in the classroom. Students can use them to study with. If you can’t find a flowchart on a particular subject, you can create one around the information you have. So, let’s first learn the basics of a flowchart and then how to make your own.
A well-crafted flowchart can help you break down complex concepts into a visual map where manageable steps are laid out. There are different types of flowcharts and main benefits better comprehension and recall.
Unlocking the Power of Visual Learning
Some students are primarily visual learners. That doesn’t mean a flowchart is not valuable for other types of learners, such as auditory, readers and writers, or tactile learners. Flowcharts simplify complex concepts by visually breaking down intricate processes into manageable steps. This enables learners to grasp connections, sequences, and decision points with greater clarity.
From teachers, to students, researchers, the use of flowcharts transform abstract ideas into visual diagrams that greatly helps everyone involved retain information more easily. It also enhances collaboration among individuals with varied learning styles, and encourages creative problem-solving through a visually engaging medium.
The versatile tool of flowcharts not only streamlines learning but also enables educators and professionals across many school subjects to communicate ideas more effectively. The result is a deeper understanding of intricate systems and the steps that need to be taken to arrive at a solution, regardless of the subject matter.
What is a Flowchart?
A flowchart is a visual representation of a process or a system, using various symbols and arrows to illustrate the flow of information or actions.
Flowcharts are commonly used in many industries, including engineering, project management, and software development, to name a few.
In the context of education, flowcharts can be used to break down complex topics or concepts into smaller, more digestible components.
This visual representation helps students see the logical progression of ideas and the relationships between different elements.
Enhancing learning and understanding through flowcharts
By visually representing complex information, flowcharts provide students with a clear and organized framework for comprehending the subject matter.
The visual nature of flowcharts helps students make connections between different concepts and see the bigger picture.
This holistic understanding promotes deeper learning and improves retention of information.
Moreover, flowcharts offer a step-by-step visualization of processes, making it easier for students to follow and remember the sequence of actions.
Whether it’s understanding a scientific experiment, a historical event, or a mathematical problem, flowcharts can simplify the learning process and make it more engaging for students.
Improving problem-solving and decision-making skills with flowcharts
Flowcharts are not just useful for understanding information; they also play a crucial role in developing problem-solving and decision-making skills in students.
When faced with a complex problem or a decision-making scenario, students can use flowcharts to systematically evaluate their options and identify the most effective solution.
The visual nature of flowcharts helps students break down the problem into smaller, more manageable parts, allowing them to analyze each step and its potential outcomes.
This analytical thinking promotes critical thinking skills and empowers students to make informed decisions based on logical reasoning.
By practicing problem-solving with flowcharts, students develop a structured approach to tackling challenges, which can be applied to various aspects of their academic and personal lives.
Steps to Creating a Flowchart
Creating a flowchart may seem a bit overwhelming, but they can also be a lot of fun! Here are 7 steps to take:
Step 1: Define the Objective
Before diving into the flowchart creation process, clearly define the objective or topic you want to visualize. This will ensure that your flowchart remains focused and serves its purpose effectively.
Step 2: Identify the Key Components
Break down the objective or topic into its key components or steps. These components will serve as the foundation for your flowchart and should be organized in a logical sequence.
Step 3: Determine the Flowchart Structure
Decide on the type of flowchart structure that best suits your objective. There are various types of flowcharts, including process flowcharts, decision flowcharts, and system flowcharts. Choose the structure that aligns with the nature of the subject you’re working on.
Step 4: Select the appropriate symbols and shapes
Flowcharts utilize symbols and shapes to represent different actions, decisions, and processes. Familiarize yourself with the commonly used symbols, such as rectangles for processes, diamonds for decisions, and arrows for connecting steps. Choose the symbols and shapes that best represent the actions and decisions within your flowchart.
Step 5: Organize the information
Arrange the key components in a logical flow within the flowchart. Start with the initial step at the top and progress downwards, following the sequence of actions or decisions.
Step 6: Add visuals and colors
Enhance the visual appeal of your flowchart by incorporating colors and visuals. Use colors to distinguish different steps or components, making it easier for the viewer to navigate the flowchart. Visuals, such as icons or illustrations, can also aid in conveying information more effectively.
Step 7: Review and refine
Once you’ve created your flowchart, review it to ensure clarity and accuracy. Make any necessary revisions or adjustments to improve the flow and readability. Consider seeking feedback from peers or educators to get different perspectives and refine your flowchart further.
By following these steps, you’ll be well on your way to creating a flowchart that effectively represents the subject matter and facilitates better understanding.
Choosing the right symbols and shapes
The symbols and shapes you choose for your flowchart play a crucial role in conveying information accurately. Here are some commonly used symbols and shapes and their meanings:
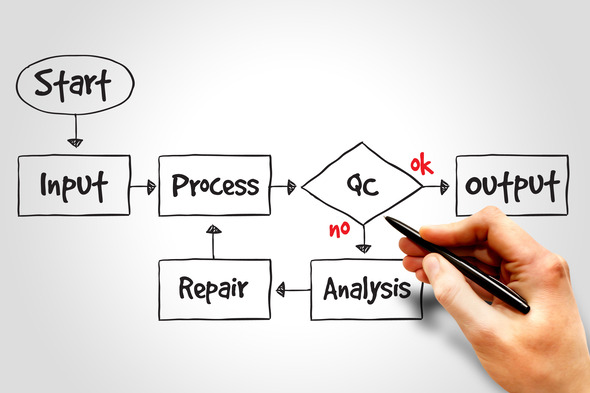
- Rectangle: Represents a process or action. This shape is used to depict a step or task within the flowchart.
- Diamond: Represents a decision point. This shape is used when a decision needs to be made and branches the flowchart into different paths based on the outcome.
- Circle: Represents the beginning or end of the flowchart. This shape indicates the beginning or conclusion of a process.
- Arrow: Represents the flow of information or progression from one step to another. Arrows are used to connect different steps or components within the flowchart.
It’s essential to choose symbols and shapes that accurately represent the actions, decisions, and processes within your flowchart. Consistency in symbol usage throughout the flowchart will ensure clarity and ease of understanding.
Organizing information and creating a logical flow
Creating a flowchart involves organizing information in a logical and sequential manner. Here are some tips to help you create a well-structured flowchart:
- Start with a clear objective: Clearly define the objective or topic you want to visualize in your flowchart. This will provide a focus and guide the organization of information.
- Break down the objective into steps: Identify the key components or steps required to achieve the objective. These steps should be organized in a logical sequence, ensuring a smooth flow of information.
- Use appropriate connectors: Arrows are used to connect different steps or components within a flowchart. Use connectors to indicate the flow of information or progression from one step to another. Ensure that the connectors are clear and unambiguous.
- Avoid clutter: Keep the flowchart clean and uncluttered by using concise labels and minimizing unnecessary details. Focus on the essential actions, decisions, or processes that need to be represented.
By organizing information in a logical and structured manner, you’ll create a flowchart that is easy to follow and understand, maximizing its effectiveness as a visual learning tool.
Adding visuals and colors to enhance comprehension
Here are some ways to incorporate visuals and colors effectively to help students retain information as they learn:
- Use colors strategically: Colors can be used to distinguish different steps or components within the flowchart. Assign specific colors to specific types of actions or decisions to create visual associations. Ensure that the chosen colors are visually appealing and do not cause confusion.
- Include icons or illustrations: Visual elements such as icons or illustrations can aid in conveying information more effectively. Use relevant icons or illustrations to represent actions or decisions within the flowchart. This can make the flowchart more engaging and memorable.
- Utilize whitespace: Whitespace refers to the empty space between different elements within a flowchart. Use whitespace strategically to create a visually balanced flowchart. This will help prevent overcrowding and ensure that the flowchart is easy on the eyes.
By incorporating visuals and colors thoughtfully, you’ll create flowcharts that are not only informative but also visually engaging, enhancing the overall learning experience.
Incorporating flowcharts into different school subjects
Flowcharts can be applied to various school subjects, helping students navigate complex topics and improve their understanding. Flowcharts can be incorporated into research papers to make presentations and arguments more compelling.
Examples of flowcharts
To provide a clearer understanding of how flowcharts can be applied in different school subjects, here are some examples:
Mathematics:
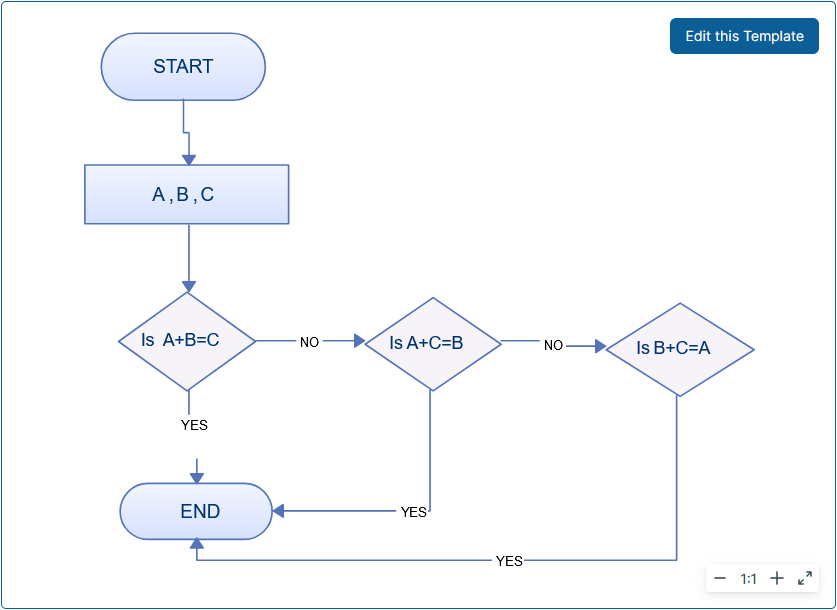
Flowcharts can be used to break down complex mathematical equations or problem-solving processes. By visualizing the steps and decisions involved in solving a math problem, students can better understand the underlying concepts and apply them more effectively.
START –> Read the problem –> Identify the given variables –> Determine the required operation –> Perform the calculation –> Check the answer –> END
Science:
Science subjects often involve complex processes and experiments. Flowcharts can help students visualize these processes, including the different steps, variables, and possible outcomes. This visual representation can aid in understanding the cause and effect relationships within scientific concepts.
START –> Conduct background research –> Formulate hypothesis –> Design experiment –> Collect data –> Analyze data –> Draw conclusions –> END
History:
Flowcharts can be used to analyze historical events and their consequences. By mapping out the sequence of events and the decisions made by key figures, students can gain a deeper understanding of the historical context and its impact on the present.
START –> Identify the historical event –> Research the context and key figures –> Map out the sequence of events –> Analyze the consequences –> Reflect on the significance –> END
Language Arts:
Flowcharts can assist in understanding and analyzing complex literary works. By mapping out the plot, character development, and themes, students can visualize the connections between different elements of the story, enhancing their comprehension and interpretation.
START –> Read the literary work –> Identify the main characters and their traits –> Analyze the plot structure –> Identify the key themes –> Interpret the symbolism –> Reflect on the author’s message –> END
By incorporating flowcharts into different school subjects, students can approach their studies with a visual and structured mindset, leading to improved understanding and retention of information.
Benefits of using flowcharts in education
Flowcharts offer a multitude of benefits when incorporated into the educational setting.
Let’s explore some of the key advantages of using flowcharts to enhance the learning experience of students.
Math: Visualizing problem-solving steps
In math classes, flowcharts can be used to visualize the step-by-step process of solving complex problems. For example, when solving an algebraic equation, a flowchart can illustrate the different operations and their sequence. This visual representation helps students understand the logical flow of solving the problem and identify any errors in their calculations.
Flowcharts can also be used to explain mathematical concepts, such as geometric formulas or statistical analysis methods. By presenting these concepts visually, students can grasp the underlying principles more easily and apply them accurately.
Science: Mapping out experiments and processes
In science classes, flowcharts can be utilized to map out experiments and processes. For instance, in a biology class, a flowchart can illustrate the steps involved in a scientific experiment, such as the scientific method. This visual representation helps students understand the order and significance of each step and ensures they follow the correct procedure.
Flowcharts can also be used to explain complex scientific concepts, such as the water cycle or the process of photosynthesis. By breaking down these concepts into smaller components, students can visualize the interactions and relationships between different elements, leading to a deeper understanding.
Language Arts: Analyzing literature and storytelling
In language arts classes, flowcharts can be used to analyze literature and storytelling. For example, a flowchart can depict the plot structure of a novel or a play, highlighting the key events and their sequence. This visual representation allows students to analyze the story’s progression and identify the main plot points.
Flowcharts can also be used to analyze literary devices, such as symbolism or foreshadowing. By visually representing these elements, students can interpret their meaning more effectively and analyze their impact on the overall narrative.
Flowcharts can be particularly beneficial for visual learners who may struggle with traditional textual analysis.
Examples of flowcharts in different educational settings
To further illustrate the benefits of using flowcharts in education, let’s explore some real-world examples of flowcharts being used in different educational settings.
Elementary School: Understanding the Water Cycle
In an elementary school science class, a flowchart can be used to help students understand the water cycle. The flowchart would visually represent the various stages of the water cycle, such as evaporation, condensation, and precipitation. By following the flowchart, students can see how water moves through the different stages and understand the cyclical nature of the process.
This visual representation helps students grasp the concept more easily and reinforces their understanding of the water cycle.
High School: Analyzing Shakespearean Sonnets
In a high school English literature class, a flowchart can be used to analyze Shakespearean sonnets. The flowchart would break down the structure and rhyme scheme of the sonnet, guiding students through the different elements. By analyzing the flowchart, students can identify the pattern of the sonnet and understand its impact on the overall meaning.
Flowcharts can also be used to analyze the themes and literary devices used in the sonnet, providing a visual framework for deeper analysis. This visual approach enhances students’ understanding of Shakespearean sonnets and encourages critical thinking.
College: Mapping out Computer Algorithms
In a college computer science class, a flowchart can be used to map out complex computer algorithms. The flowchart would illustrate the logical flow of the algorithm, including conditional statements, loops, and variable assignments. By following the flowchart, students can understand the sequence of steps involved in executing the algorithm and identify any potential errors.
Flowcharts provide a visual representation of the algorithm’s structure, making it easier for students to analyze and optimize the code. This visual approach enhances students’ understanding of computer algorithms and strengthens their programming skills.
Conclusion
Flowcharts have the potential to revolutionize the way we teach and learn. By unlocking the power of visual thinking, flowcharts enhance comprehension, stimulate critical thinking, and promote collaboration. From simplifying complex topics to improving problem-solving skills, flowcharts offer a versatile tool for educators in all subject areas. By incorporating flowcharts into lesson plans and curriculum, educators can create engaging and interactive learning experiences that empower students.
So, let’s embrace the power of flowcharts in education and unlock the full potential of visual thinking for the next generation of learners.
This article provides general guidelines and suggestions for creating flowcharts. The specific requirements and preferences may vary depending on your educational institution or individual preferences.